Plot regression and fractions for each month between parts of nutrient and total
Source:R/plotting.R
plot_fractions.RdPlot regression and fractions for each month between parts of nutrient and total
Arguments
- df
dataframe with formatted data (Station, DATE, Variables and Values columns are needed).
- station
character vector indicating station/s, which should be selected for figure.
- total_var
character vector for variable selected to represent total of certain variable.
- min_vars
character vector for variable/s selected to represent mineral or organic of certain variable.
Value
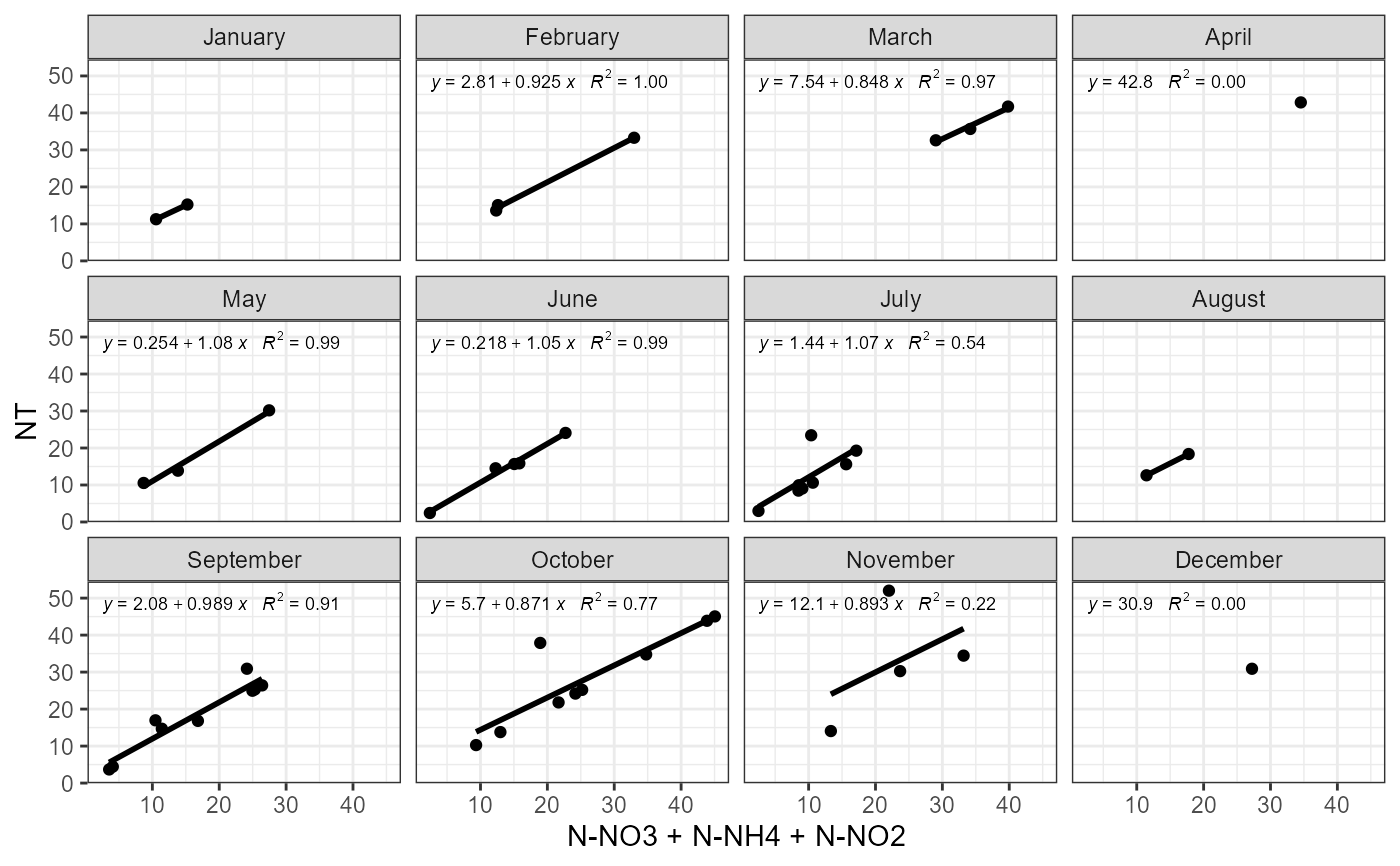
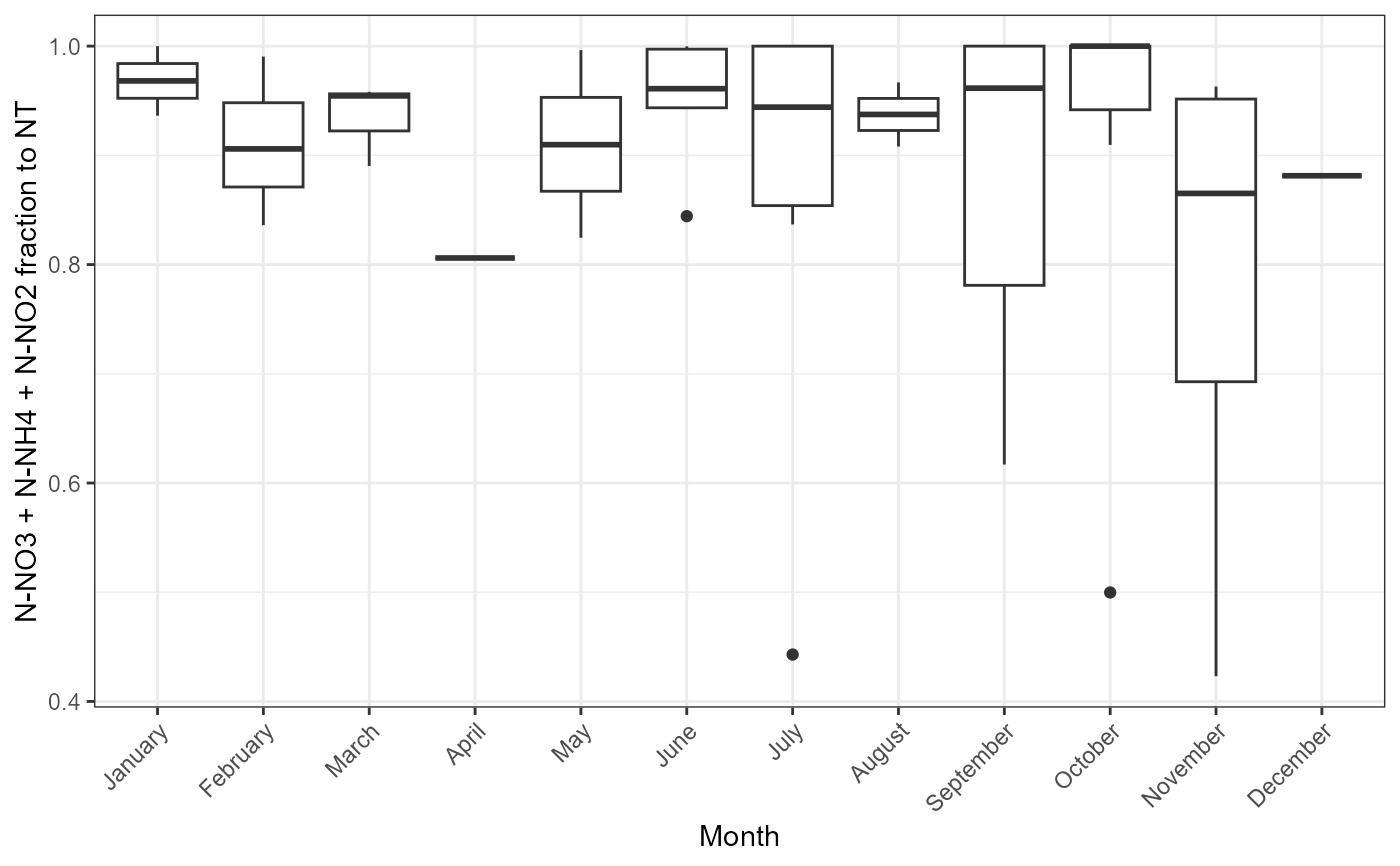
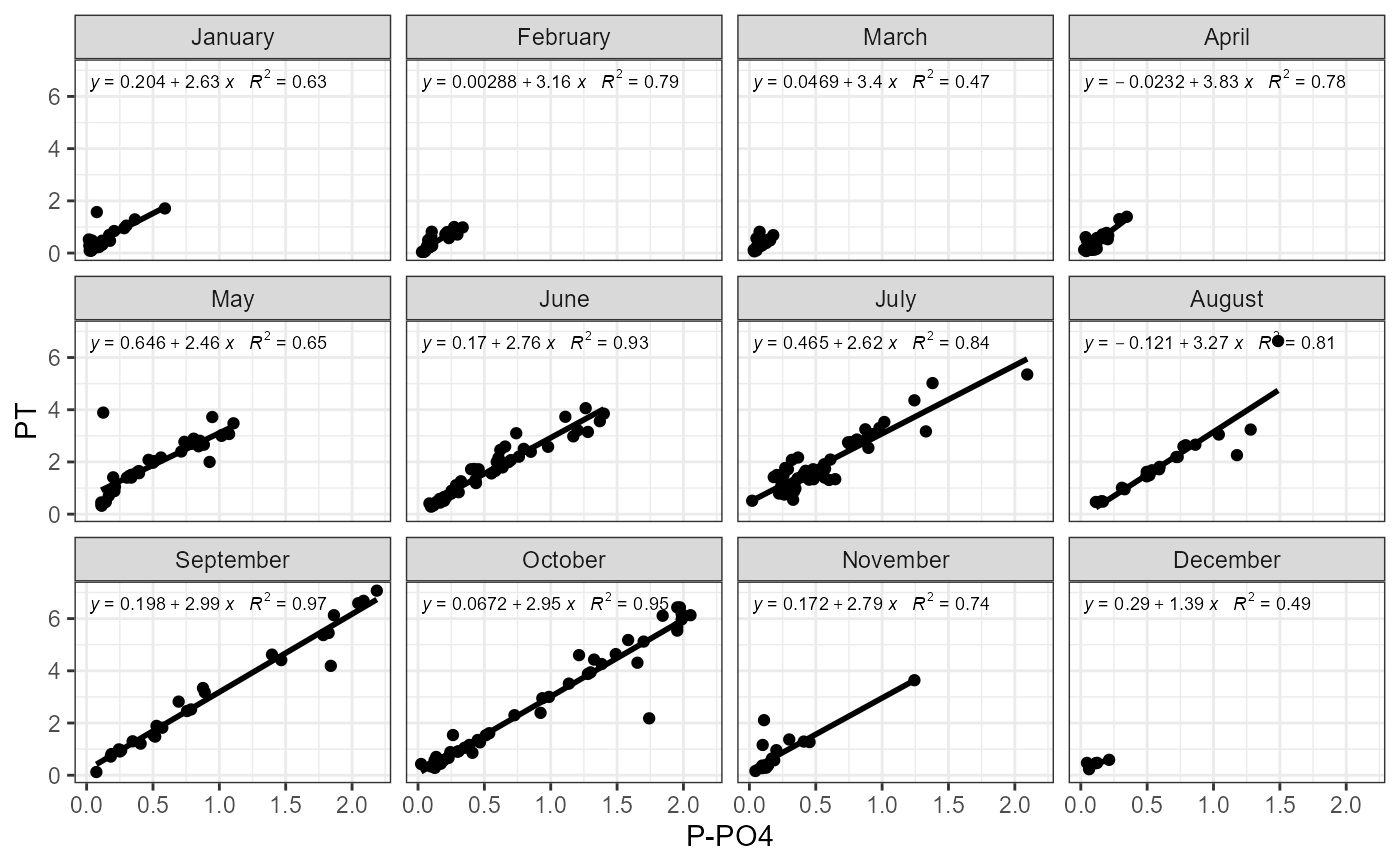
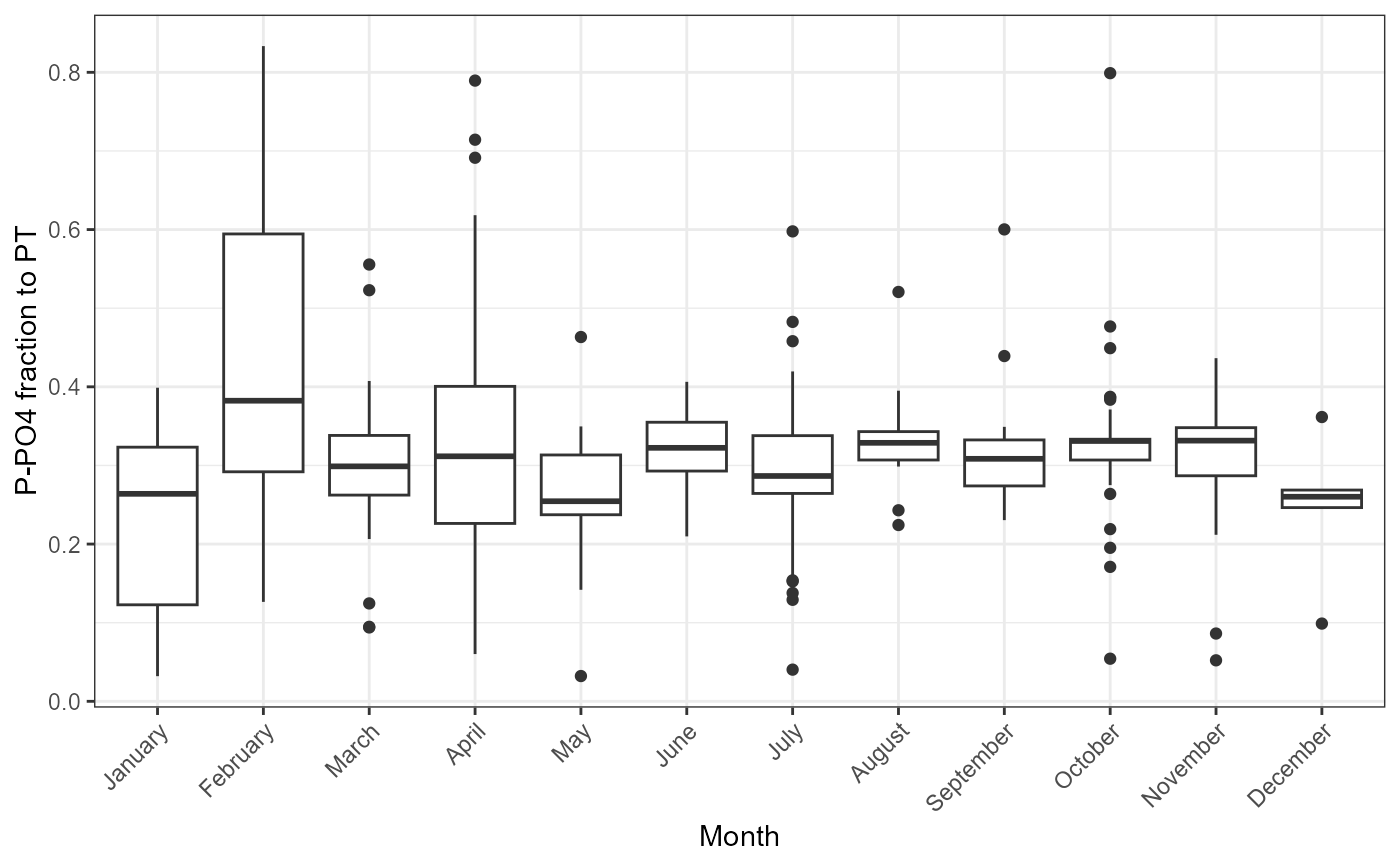
list of two ggplot objects: regression - monthly regression plots for total vs some part (i.e. mineral or organic), fraction - monthly fraction values.
Examples
temp_path <- system.file("extdata", "calibration_data.xlsx", package = "svatools")
cal_data <- load_template(temp_path)
#> [1] "Loading data from template."
#> [1] "Loading of data is finished."
plot_fractions(cal_data$data, c("4"), c("NT"), c("N-NO3", "N-NH4", "N-NO2"))
#> $regression
#> Warning: Upper limit outside search range. Set to the maximum of the parameter range.
#> Warning: Computation failed in `stat_poly_eq()`
#> Caused by error in `check_output()`:
#> ! out[1] <= out[2] is not TRUE
#> Warning: Not enough data to perform fit for group 1; computing mean instead.
#> Warning: Upper limit outside search range. Set to the maximum of the parameter range.
#> Warning: Computation failed in `stat_poly_eq()`
#> Caused by error in `check_output()`:
#> ! out[1] <= out[2] is not TRUE
#> Warning: Not enough data to perform fit for group 1; computing mean instead.
 #>
#> $fraction
#>
#> $fraction
 #>
plot_fractions(cal_data$data, c("4"), c("PT"), c("P-PO4"))
#> $regression
#>
plot_fractions(cal_data$data, c("4"), c("PT"), c("P-PO4"))
#> $regression
 #>
#> $fraction
#>
#> $fraction
 #>
#>